* This page is the English translation of the original Italian blog post I wrote in the ICTeam blog
In this post I describe a problem with a query executed in PARALLEL mode on an Exadata version 12.2 using a compressed table.
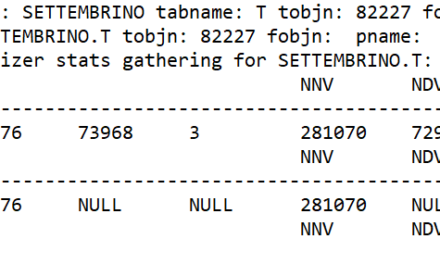
I had found a wrong cardinality estimate on a table of only 204 rows that has compromised a complex execution plan determining some Nested Loops on tables of hundreds of millions of rows. This was the critical point of the execution plan that triggered the problem:
-----------------------------------------------------------------------------------+--------
| Id  | Operation                                      | Name                      | Rows  |
-----------------------------------------------------------------------------------+--------
...
| 18  |                   HASH JOIN                    |                           |     1 |
| 19  |                    JOIN FILTER CREATE          | :BF0002                   |     1 |
| 20  |                     TABLE ACCESS STORAGE FULL  | T1                        |     1 |
| 21  |                    JOIN FILTER USE             | :BF0002                   |   10M |
| 22  |                     PX BLOCK ITERATOR          |                           |   10M |
| 23  |                      TABLE ACCESS STORAGE FULL | T2                        |   10M |
...
--------------------------------------------------------------------------------------------
The Oracle optimizer calculated a cardinality of 0 rows on table T1 (1 by default) and the Hash Join estimate on the row 18 of the execution plan was incorrect.
In reality, the number of rows extracted from table T1 was greater than 100 and the (real) hash join result was of a few million of rows, not 1 row. The problem was then propagated to the other steps of the execution plan and so the plan was inevitably suboptimal.
Table T1, as already said, was a very small (only 204 rows) COMPRESS table (I usually prefer to avoid compression on a small table like this). Frequent updates (UPDATE) on the table have changed the position of the rows (migrated rows) leaving almost all blocks empty. This was the fragmentation status of the table:
Unformatted Blocks .....................             112
FS1 Blocks (0-25)  .....................               1
FS2 Blocks (25-50) .....................               0
FS3 Blocks (50-75) .....................               0
FS4 Blocks (75-100).....................              15
Full Blocks        .....................               5
Total Blocks         ...................           8,232
Total Bytes          ...................      67,436,544
Total MBytes         ...................              64
Unused Blocks        ...................           8,064
Unused Bytes         ...................      66,060,288
Last Used Ext FileId ...................              18
Last Used Ext BlockId...................     147,794,688
Last Used Block      ...................             128
Table T1 had 8382 blocks of which 5 full and 16 partially full and more than 8000 empty blocks.
What impact does the fragmentation state of the T1 table have on the Oracle optimizer cardinality estimate?
On table T1 there was a predicate as a BETWEEN dt_init_val AND dt_end_val. With gathered statistics, the Query Optimizer decided to use a (very unfortunate) dynamic sampling equal to 6 to try to understand the number of rows that were in the range of data (dt_init_val … dt_end_val). In particular, a sampling of only 1.5% of the blocks was used and the bad luck (for Oracle but also mine) was that the 128 blocks used as samples were all empty blocks due to the high table fragmentation. What a mess!!! The Query Optimizer then believed to come out with 0 rows from table T1 and the plan was definitely wrong.
Here is the section of the 10053 trace file where the selectivity of the predicate was estimated:
** Executed dynamic sampling query:
    level : 6
    sample pct. : 1.550293
    actual sample size : 0
    filtered sample card. : 0
    orig. card. : 204
    block cnt. table stat. : 8192
    block cnt. for sampling: 8192
    max. sample block cnt. : 128
    sample block cnt. : 127
    min. sel. est. : 0.37009804
** Using single table dynamic sel. est. : 0.00000000
Here is the query used by the Query Optimizer to calculate the (estimated) cardinality:
** Generated dynamic sampling query:

    query text :

SQL> SELECT /* OPT_DYN_SAMP */ /*+ ALL_ROWS IGNORE_WHERE_CLAUSE RESULT_CACHE(SNAPSHOT=3600) opt_param('parallel_execution_enabled', 'false') NO_PARALLEL(SAMPLESUB) NO_PARALLEL_INDEX(SAMPLESUB) NO_SQL_TUNE */
  2         NVL(SUM(C1),0), NVL(SUM(C2),0)
  3  FROM (SELECT /*+ IGNORE_WHERE_CLAUSE NO_PARALLEL("T1") FULL("T1") NO_PARALLEL_INDEX("T1") */
  4              1 AS C1,
  5  CASE WHEN "T1"."DT_INIT_VAL"<=TO_DATE(' 9999-12-31 00:00:00', 'syyyy-mm-dd hh24:mi:ss')
  6           AND "T1"."DT_END_VAL">=TO_DATE(' 9999-12-31 00:00:00', 'syyyy-mm-dd hh24:mi:ss')
  7  THEN 1
  8  ELSE 0
  9     END AS C2
 10   FROM "SETTEMBRINO"."T1" SAMPLE BLOCK (1.550293 , 1) SEED (1) "T1"
 11  ) SAMPLESUB;

NVL(SUM(C1),0) NVL(SUM(C2),0)
-------------- --------------
             0              0
As previously mentioned, the use of Dynamic Sampling caused a sample of 1.55% of the blocks: the value 0 in the NVL column (SUM (C2), 0) represents the cardinality value by applying the predicate on the T1 table.
Once I understood the problem I found the (performance) solution. After the reorganization of the table space (ALTER TABLE MOVE), the execution plan returned optimal and the blocks went from 8192 to only 37; a 100% sample was used by the query Optimizer which from that moment had the correct cardinality estimate. So be careful when defining a table.

Commenti recenti