* This page is the English translation of the original Italian blog post I wrote in the ICTeam blog
Recently I had to analyze an Oracle DB that showed high elapsed times on some SQL statements that “under normal conditions” were executed in parallel.
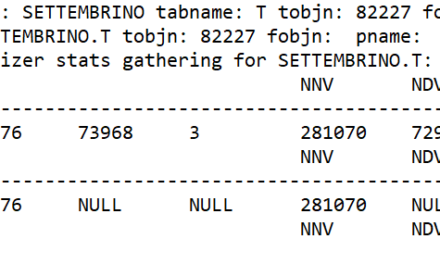
The SQL statements with a slowdown were all executed by the same application and they performed a full table scan on a large table defined with parallel_clause equal to 16.
From the point of view of the server processes used, the situation of the DB was the following:
 SQL> SELECT * FROM v$px_process_sysstat;

 STATISTIC                          VALUE
 ------------------------------ ---------
 Servers In Use                       248
 Servers Available                      8
 Servers Started                   150838
 Servers Shutdown                  150646
 Servers Highwater                    256
 Servers Cleaned Up                     0
 Server Sessions                  1066951
 Memory Chunks Allocated               16
 Memory Chunks Freed                    0
 Memory Chunks Current                 16
 Memory Chunks HWM                     16
 Buffers Allocated               15900444
 Buffers Freed                   15893892
 Buffers Current                     6552
 Buffers HWM                         9827
The DB had 248 parallel servers in use and 8 available (the parallel_max_server on the DB was set to 256). I then performed a Full Table Scan on the table (always the one defined with the parallel_clause at 16):
SELECT COUNT(*) FROM tabella;
so I looked at the v$pq_sesstat to verify that the query was run in parallel and the DOP was used:
 SQL> select * from V$Pq_sesstat;

 STATISTIC                      LAST_QUERY SESSION_TOTAL
 ------------------------------ ---------- -------------
 Queries Parallelized                    1             1
 DML Parallelized                        0             0
 DDL Parallelized                        0             0
 DFO Trees                               1             1
 Server Threads                          8             0
 Allocation Height                       8             0
 Allocation Width                        1             0
 Local Msgs Sent                       406           406
 Distr Msgs Sent                         0             0
 Local Msgs Recv'd                     406           406
 Distr Msgs Recv'd                       0             0
The query was then executed in parallel but with a downgraded from parallel 16 to 8, at that time, in fact only 8 px servers were available as indicated by the V$PX_PROCESS_SYSSTAT. Under these conditions, all queries that were executed in parallel would have been penalized and therefore would have suffered a higher elapsed time.
Ok, but what does all this have to do with the SQL * Net break / reset to client event?
During the analysis I noticed a very strange situation when monitoring the sessions:
SELECT * FROM gv$session WHERE status = ‘INACTIVE’ AND event = ‘SQL*Net break/reset to client’;
I noticed that at that moment on the DB there were 15 inactive query coordinator (QC) sessions on the “SQL * Net break / reset to client” wait event, sessions all executed from the same application , some even in life from different days before, which all accessed the same table (always the one defined with parallel clause 16). At some point on the DB there were 15 * 16 (240) server processes busy doing nothing. The SQL statements were left hanging because the client had to unhook the session and the queries were orphaned but the session was not dead and therefore its parallel processes were not dead. The parallel processes existed but were doing nothing because their query coordinator (QC) session was waiting for the client to accept the reset / break. After the kill of these sessions the situation was the following:
 SQL> select * from V$PX_PROCESS_SYSSTAT;

 STATISTIC                                     VALUE
 ------------------------------------------ --------
 Servers In Use                                    0
 Servers Available                                64
 Servers Started                              151230
 Servers Shutdown                             151230
 Servers Highwater                               256
 Servers Cleaned Up                                0
 Server Sessions                             1069615
 Memory Chunks Allocated                          16
 Memory Chunks Freed                               0
 Memory Chunks Current                            16
 Memory Chunks HWM                                16
 Buffers Allocated                          15937578
 Buffers Freed                              15937578
 Buffers Current                                   0
 Buffers HWM                                    9827
After killing the sessions, in rest conditions, the DB therefore kept alive only 64 server processes available (parallel_min_server) and 0 server processes in use. When the load went up, it would activate others up to a maximum of 256 (parallel_max_server).
If you ever see a DB that accuses symptoms like those just described, remember what has just been written in this post.

Commenti recenti