* This page is the English translation of the original Italian blog post I wrote in the ICTeam blog
I recently encountered a strange behavior of the Oracle optimizer on a MERGE SQL statement.
The problem
The average execution times for this SQL statement were about 5-8 minutes, the SQL statement was composed of a “simple” MERGE between a partitioned table on about 1.5 billion rows and an empty table (??). Why all this time if a table is empty!
I then ran a test case, I created two tables that I called T_BIG with 510M of rows and T_SMALL with 0 rows.
Compared to the real case, my big table has less than half of the rows and a much lower number of columns (in the real case the table had about 100 columns) but it doesn’t matter, the problem also occurs with a lower number of rows and columns .
I run the MERGE with a DOP of 4 enabling the parallel DML mode on a Oracle db 12c Release 12.2:
SQL> select banner from v$version;
BANNER
----------------------------------------------------------------------------
Oracle Database 12c Enterprise Edition Release 12.2.0.1.0 - 64bit Production
PL/SQL Release 12.2.0.1.0 - Production
CORE 12.2.0.1.0 Production
TNS for Linux: Version 12.2.0.1.0 - Production
NLSRTL Version 12.2.0.1.0 - Production


SQL> MERGE /*+ PARALLEL(4) ENABLE_PARALLEL_DML */ INTO t_big b
  2  USING t_small a
  3  ON (a.id=b.id)
  4  WHEN MATCHED THEN
  5  UPDATE /*+ PARALLEL(4) */
  6  SET b.d2=TO_DATE('19-MAR-2020 00:00:00', 'dd-mon-yyyy hh24:mi:ss')-(1/24/60/60),
  7          b.d3= TO_DATE('19-MAR-2020 00:00:00', 'dd-mon-yyyy hh24:mi:ss')
  8  WHEN NOT MATCHED THEN
  9  INSERT (ID, d1, d2, d3, v)
 10  VALUES (a.id, a.d, a.d, a.d, a.v);
0 di righe unite.
Passati: 00:00:14.31
why does it take 14 seconds if the t_small table is empty? (in the real case, as already mentioned, the times were much higher). If I run the same SQL statement sequentially I have a first surprise:
SQL> MERGE /*+ NO_PARALLEL */ INTO t_big b
  2  USING t_small a
  3  ON (a.id=b.id)
  4  WHEN MATCHED THEN
  5  UPDATE
  6  SET b.d2=TO_DATE('19-MAR-2020 00:00:00', 'dd-mon-yyyy hh24:mi:ss')-(1/24/60/60),
  7          b.d3= TO_DATE('19-MAR-2020 00:00:00', 'dd-mon-yyyy hh24:mi:ss')
  8  WHEN NOT MATCHED THEN
  9  INSERT (ID, d1, d2, d3, v)
 10  VALUES (a.id, a.d, a.d, a.d, a.v);

0 di righe unite.

Passati: 00:00:00.02
Elapsed time of a few microseconds, why this difference?
Analysis of the problem using SQL MONITOR
Using SQL monitor I noticed that the elapsed time of the SQL statement executed in PARALLEL mode is spent / lost almost completely in I / O:
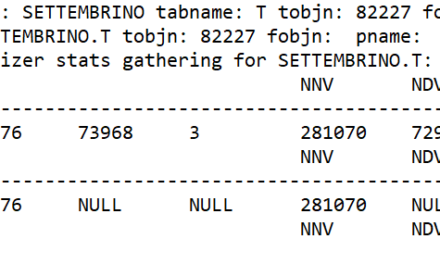
Global Information
------------------------------
 Status              :  DONE
 Instance ID         :  1
 Session             :  SETTEMBRINO (264:53010)
 SQL ID              :  1avy88pz9nzz4
 SQL Execution ID    :  16777217
 Execution Started   :  05/08/2020 01:53:22
 First Refresh Time  :  05/08/2020 01:53:22
 Last Refresh Time   :  05/08/2020 01:53:36
 Duration            :  14s
 Module/Action       :  SQL*Plus/-
 Service             :  ora12b1.icteam.local
 Program             :  sqlplus.exe

Global Stats
========================================================
| Elapsed |   Cpu   |    IO    | Buffer | Read | Read  |
| Time(s) | Time(s) | Waits(s) |  Gets  | Reqs | Bytes |
========================================================
|      57 |      55 |     1.91 |   893K | 7073 |   7GB |
========================================================
900k buffers are read to perform a MERGE against a 0-row table, so all unnecessary I / O.
The execution plan confirms that almost all the time (14 sec) is spent reading the t_big table.

*Note: pay attention to line 6 of the execution plan, “VIEW” may indicate an optimized and transformed query block.
In sequential mode the SQL statement lasts 264 microseconds, the I/O disappears completely:

Tracing SQL statement
Looking at the trace file 10053 I identified the transformation from the query optimizer:
CVM:   Merging SPJ view SEL$2 (#0) into SEL$1 (#0)
Registered qb: SEL$F5BB74E1 0xb06cf68 (VIEW MERGE SEL$1; SEL$2; SEL$1)
The transformation applied is CVM (Complex View Merging) type, Oracle then generates a new block (qb indicates a query block) named SEL$F5BB74E1 which is the result of the merge between the SEL$2 block (table T_BIG) and SEL$1 (table T_SMALL). The new block created, SEL$F5BB74E1, corresponds to the following SELECT SQL statement:
SQL> SELECT 0
  2  FROM  (SELECT /*+ NO_MERGE */ "B".ROWID,"B"."ID" "ID","B"."D1" "D1","B"."D2" "D2","B"."D3" "D3","B"."V" "V","A"."ID" "ID","A"."D" "D","A"."V" "V"
  3        FROM "SETTEMBRINO"."T_SMALL" "A","SETTEMBRINO"."T_BIG" "B"
  4        WHERE "A"."ID"="B"."ID"(+)
  5    ) "from$_subquery$_006","SETTEMBRINO"."T_SMALL" "A","SETTEMBRINO"."T_BIG" "B"
  6  ;

Nessuna riga selezionata
Passati: 00:00:14.80
The elapsed time of this last execution is closely to the 14 seconds used by MERGE SQL statement. So the time taken by the MERGE statement is spent/lost by this block to recover any useful rows.
How can I solve the performance problem?
The internal transformation implemented by the query optimizer is not visible when looking at the MERGE execution plan only. But now I know that a CVM transformation has been performed. For example, I could think of inhibiting the transformation by using the NO_QUERY_TRANSFORMATION hint:
SQL> MERGE /*+ parallel(4) enable_parallel_dml NO_QUERY_TRANSFORMATION */ INTO t_big b
  2  USING t_small a
  3  ON (a.id=b.id)
  4  WHEN MATCHED THEN
  5  UPDATE /*+ PARALLEL(4) */ SET b.d2=TO_DATE('19-MAR-2020 00:00:00','dd-mon-yyyy hh24:mi:ss')-(1/24/60/60),
  6                                b.d3= TO_DATE('19-MAR-2020 00:00:00', 'dd-mon-yyyy hh24:mi:ss')
  7  WHEN NOT MATCHED THEN
  8  INSERT (ID, d1, d2, d3, v)
  9  VALUES (a.id, a.d, a.d, a.d, a.v);

0 di righe unite.

Passati: 00:00:00.05
Ok, I reach my goal (the MERGE execution time is practically equal to zero) but I also disabled all the transformation features of the query optimizer, can I do something better? Let’s take a look at the Outline section of the execution plan:
SQL> SELECT * FROM TABLE(DBMS_XPLAN.DISPLAY(format=>'basic +alias +outline'));

----------------------------------------------------
| Id  | Operation                       | Name     |
----------------------------------------------------
|   0 | MERGE STATEMENT                 |          |
|   1 |  PX COORDINATOR                 |          |
|   2 |   PX SEND QC (RANDOM)           | :TQ10003 |
|   3 |    MERGE                        | T_BIG    |
|   4 |     PX RECEIVE                  |          |
|   5 |      PX SEND HYBRID (ROWID PKEY)| :TQ10002 |
|   6 |       VIEW                      |          |
|   7 |        HASH JOIN OUTER BUFFERED |          |
|   8 |         JOIN FILTER CREATE      | :BF0000  |
|   9 |          PX RECEIVE             |          |
|  10 |           PX SEND HASH          | :TQ10000 |
|  11 |            PX BLOCK ITERATOR    |          |
|  12 |             TABLE ACCESS FULL   | T_SMALL  |
|  13 |         PX RECEIVE              |          |
|  14 |          PX SEND HASH           | :TQ10001 |
|  15 |           JOIN FILTER USE       | :BF0000  |
|  16 |            PX BLOCK ITERATOR    |          |
|  17 |             TABLE ACCESS FULL   | T_BIG    |
----------------------------------------------------

Query Block Name / Object Alias (identified by operation id):
-------------------------------------------------------------

   1 - MRG$1
   7 - SEL$F5BB74E1
  12 - SEL$F5BB74E1 / A@SEL$1
  17 - SEL$F5BB74E1 / B@SEL$2

Outline Data
-------------

  /*+
      BEGIN_OUTLINE_DATA
      PX_JOIN_FILTER(@"SEL$F5BB74E1" "B"@"SEL$2")
      PQ_DISTRIBUTE(@"SEL$F5BB74E1" "B"@"SEL$2" HASH HASH)
      USE_HASH(@"SEL$F5BB74E1" "B"@"SEL$2")
      LEADING(@"SEL$F5BB74E1" "A"@"SEL$1" "B"@"SEL$2")
      FULL(@"SEL$F5BB74E1" "B"@"SEL$2")
      FULL(@"SEL$F5BB74E1" "A"@"SEL$1")
      USE_MERGE_CARTESIAN(@"MRG$1" "B"@"MRG$1")
      USE_MERGE_CARTESIAN(@"MRG$1" "A"@"MRG$1")
      LEADING(@"MRG$1" "from$_subquery$_006"@"MRG$1" "A"@"MRG$1" "B"@"MRG$1")
      FULL(@"MRG$1" "B"@"MRG$1")
      FULL(@"MRG$1" "A"@"MRG$1")
      NO_ACCESS(@"MRG$1" "from$_subquery$_006"@"MRG$1")
      OUTLINE(@"SEL$2")
      OUTLINE(@"SEL$1")
      OUTLINE_LEAF(@"MRG$1")
      MERGE(@"SEL$2" >"SEL$1")
      OUTLINE_LEAF(@"SEL$F5BB74E1")
      ALL_ROWS
      OPT_PARAM('optimizer_dynamic_sampling' 5)
      OPT_PARAM('_optimizer_gather_stats_on_load' 'false')
      DB_VERSION('12.2.0.1')
      OPTIMIZER_FEATURES_ENABLE('12.2.0.1')
      IGNORE_OPTIM_EMBEDDED_HINTS
      END_OUTLINE_DATA
  */
In addition to finding the subquery used in the transformation (“from$_subquery$_006″) and the query block used (which I identified in the trace file 10053 SEL$F5BB74E1) I also noticed the hint MERGE (@”SEL$2″>”SEL$1”) used (since version 12.2) to MERGE two query blocks. I insert a NO_MERGE hint on the SEL$2 query block to avoid the transformation made by the query optimizer:
SQL> MERGE /*+ PARALLEL(4) ENABLE_PARALLEL_DML NO_MERGE(@SEL$2) */ INTO t_big b
  2  USING t_small a
  3  ON (a.id=b.id)
  4  WHEN MATCHED THEN
  5  UPDATE /*+ PARALLEL(4) */ SET b.d2=TO_DATE('19-MAR-2020 00:00:00','dd-mon-yyyy hh24:mi:ss')-(1/24/60/60),
  6                                b.d3= TO_DATE('19-MAR-2020 00:00:00', 'dd-mon-yyyy hh24:mi:ss')
  7  WHEN NOT MATCHED THEN
  8  INSERT (ID, d1, d2, d3, v)
  9  VALUES (a.id, a.d, a.d, a.d, a.v);

0 di righe unite.

Passati: 00:00:00.06
Bingo !!! my MERGE statement becomes fast responding in “zero time”. The execution plan has therefore changed to find a Nested Loop in place of the hash join and the access to the big table is through the use of Lateral View (correlated inline view).
-----------------------------------------------------------
| Id  | Operation                       | Name            |
-----------------------------------------------------------
|   0 | MERGE STATEMENT                 |                 |
|   1 |  PX COORDINATOR                 |                 |
|   2 |   PX SEND QC (RANDOM)           | :TQ10001        |
|   3 |    MERGE                        | T_BIG           |
|   4 |     PX RECEIVE                  |                 |
|   5 |      PX SEND HYBRID (ROWID PKEY)| :TQ10000        |
|   6 |       VIEW                      |                 |
|   7 |        NESTED LOOPS OUTER       |                 |
|   8 |         PX BLOCK ITERATOR       |                 |
|   9 |          TABLE ACCESS FULL      | T_SMALL         |
|  10 |         PARTITION RANGE ALL     |                 |
|  11 |          PARTITION RANGE ALL    |                 |
|  12 |           VIEW                  | VW_LAT_A18161FF |
|  13 |            TABLE ACCESS FULL    | T_BIG           |
-----------------------------------------------------------
Conclusions
I can’t find an explanation for this strange behavior: in the execution plan of the original statement I notice a “normal” Hash Join to which a “normal” Bloom Filter is applied. In theory, the Oracle optimizer realizes that the build table (t_small) has a 0 rows cardinality, so the statement should avoid reading the probe table (t_big). Even the buffering in the Join operation indicated in the execution plan (HASH JOIN OUTER BUFFERED) cannot technically take place since the (hash) build table will never be built in memory, is empty. At this point I have to believe that it is a bug. This strange behavior was detected not only in version 12c but I also found it in versions 18.3 and 19.5.

Commenti recenti