If you read this now and you wanted to submit for ITOUG Tech Days 2020…. well, bad luck, you’re too late! ITOUG Tech Days 2020 was closed last week with an astonishing record of submissions! This post will analyse a bit the numbers of the submissions using the magic Oracle Analytics Cloud.

First of all, uploading the data and fixing the column settings. For example, we want to properly convert to Date our Submission Date (Data di invio in Italian). Oracle Analytics Cloud allows us to create a Preparation Script so we can reuse it the next time we upload the same dataset.

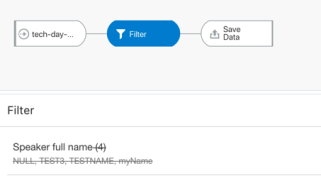
The second step is cleaning, since we have few TEST submissions, we can easily create a Dataflow to exclude them.
Now it’s time to start the analysis! Let’s have a look at the total number of submissions


Wow! We had 126 papers submitted by 52 different speakers! 2.93 times the amount of submissions we had last year! Where are our papers coming from? Let’s drag the countryand the # of Papers in a map
We had papers coming from all around the world! As expected, we have a lot from Europe, but also Australia, India, USA and Costa Rica!!!! Let’s have a look at the Country in detail

The Netherlands is the #1 country by submissions! Followed by Switzerland and……. Italy! Even if we are based in Italy, this looks a little bit suspicious: we historically had very few submissions by Italian speakers so it’s worth having a deep look at this by creating a Table View in OAC.

Some of the entries were correct indeed, but some not. Why should a speaker select Italy instead of his/her country? Well, Italia is the default value for the country selector, so that is a good reason. On top of this, the list of country names is in Italian! Making difficult for the non-italian speakers to associate for example Paesi Bassi with Netherlands or Regno Unito with United Kingdom also for the different position in the alphabetical order. Tip for next year: List of origin countries in English!
Next question: are Oracle related speakers submitting in advance or do they like to rush last minute? We just need to select the Submission Date and # of Submissions columns and drag them into the canvas; OAC will automatically suggest a line chart.

We received quite a good number of papers during the early stages of the CFP, but there is a nice spike towards the closure date with 21% of papers arriving in the 2 days finish line!
Last analysis, how are papers divided by stream, aka how many chances do I have to get a paper accepted?

The vast majority of papers goes into the Database stream, which is the most popular across all the major Oracle conferences. We also have almost 20% of submissions for the Analytics and Big Data track and few submissions for the newly created JDE stream too!
Conclusion
Thanks to all the speakers who took the time to submit! ITOUG board is amazed by the quantity and quality of the submissions received! At the same time, we know that the difficult job starts now with paper scoring and agenda selection! As you already understood with such a huge number of submission and a fixed one-day agenda per stream and location the chances of getting accepted are very low, but hey, there is always ITOUG Tech Days 2021!
This article was first posted in ftisiot.net


Commenti recenti